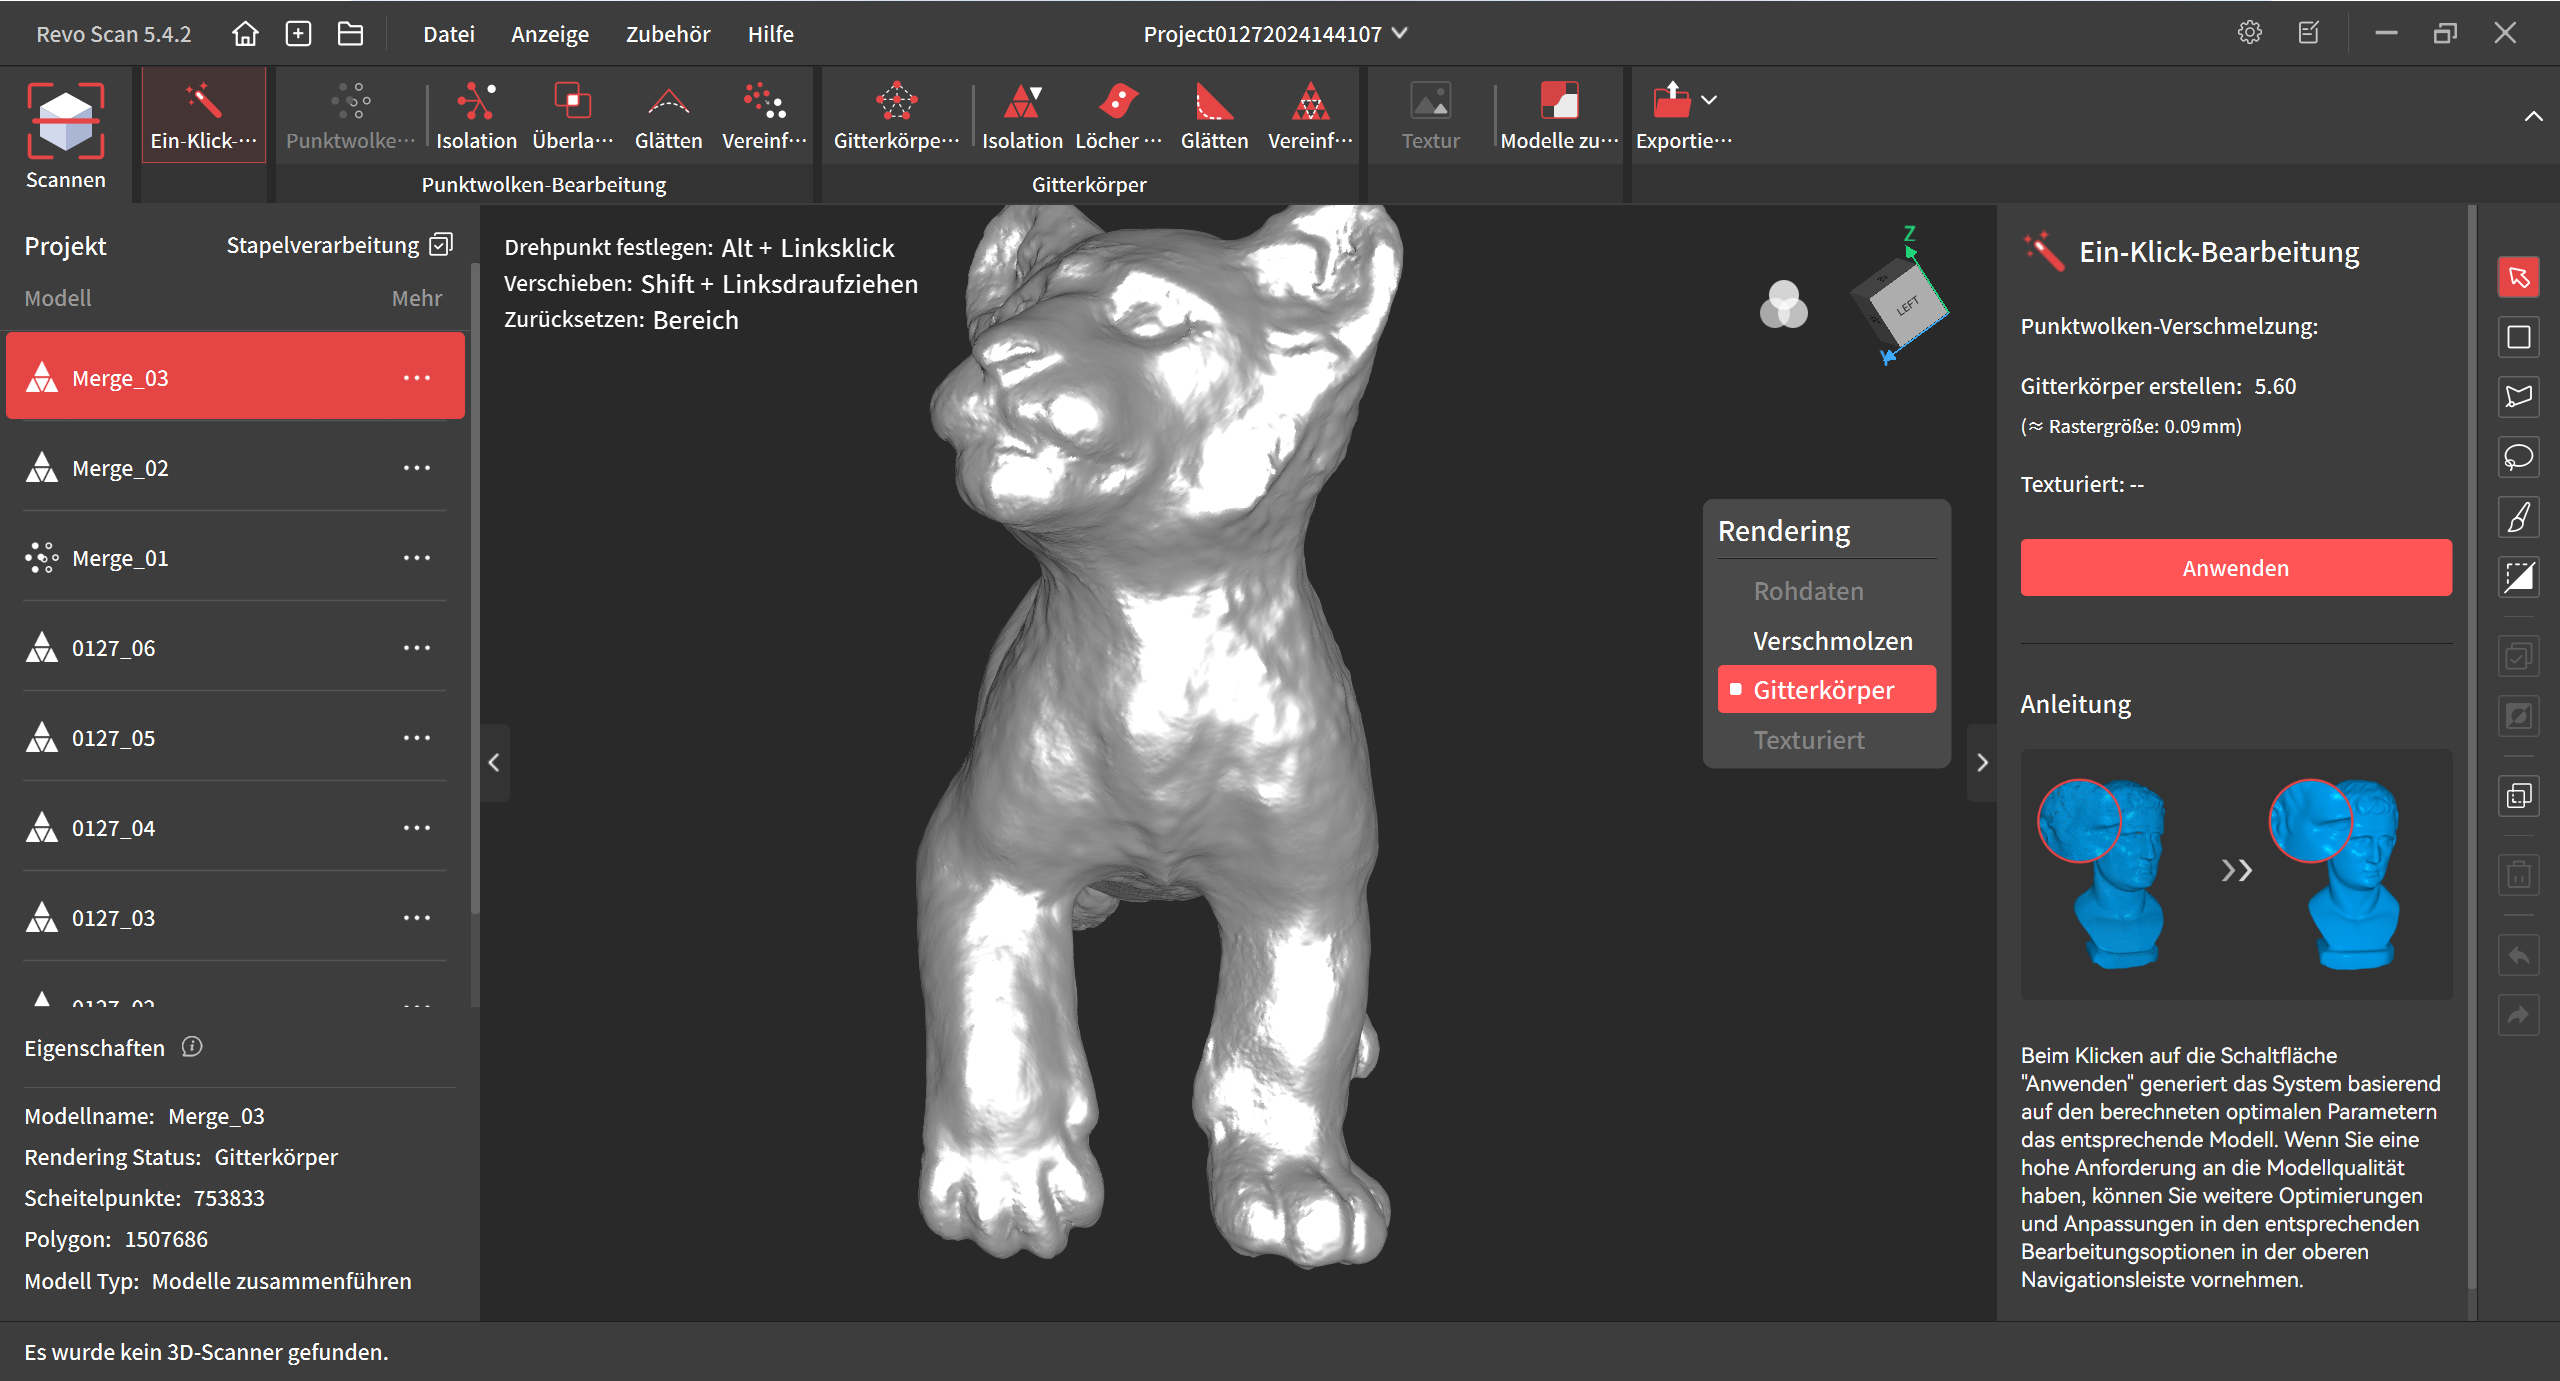
I noticed during scanning that when you scan an object from multiple sides, i.e., make several scans and then merge them at the end, it results in unclean transitions. You can see it here in the picture:

So, I conducted a test and trimmed the outer edges in the individual scans. These were quite noisy because the light or the camera of the scanner is very weak there.


The result is convincing! And I believe that if you always do this, even normal scans will benefit from it. It’s better to cut off some noise and later add it back using the hole-filling function, rather than creating a mesh with a noisy point cloud.
Here is the result:
Therefore, I have a request or a suggestion: Create a function in the menu that allows you to select the outer edge of a point cloud with one click. There should also be an option to set how much the edge should be moved inward by a percentage. Then, once everything is selected, you can create a clean edge with the delete key and produce even better scans!
I have also made an POC script here, here’s the result in 2D:

Heres the Code for that, i may help your coders to understand, the math behind can be readed in the SciPy Docs wich Release them to http://www.qhull.org/
from scipy.interpolate import splprep, splev
from scipy.spatial import ConvexHull
import matplotlib.pyplot as plt

# Options for Revoscan User
move_inner_percent = 5

# Example Pointcloud
np.random.seed(0)
points = np.random.rand(30, 2) * 2 - 1

# Find outer contour (Convex Hull)
hull = ConvexHull(points)
hull_points = points[hull.vertices]

# Move 5% to inner
move_factor = 1 - move_inner_percent / 100
hull_center = np.mean(hull_points, axis=0)
hull_points_shifted = hull_center + move_factor * (hull_points - hull_center)

# Plot
plt.figure(figsize=(10, 5))
plt.plot(points[:,0], points[:,1], "o", label="Pointcloud")
plt.plot(hull_points[:,0], hull_points[:,1], "r--", label="Original Contour")
plt.plot(hull_points_shifted[:,0], hull_points_shifted[:,1], "g--", label="New Contour")
plt.legend()
plt.title("Poincloud with Contours")
plt.show()

